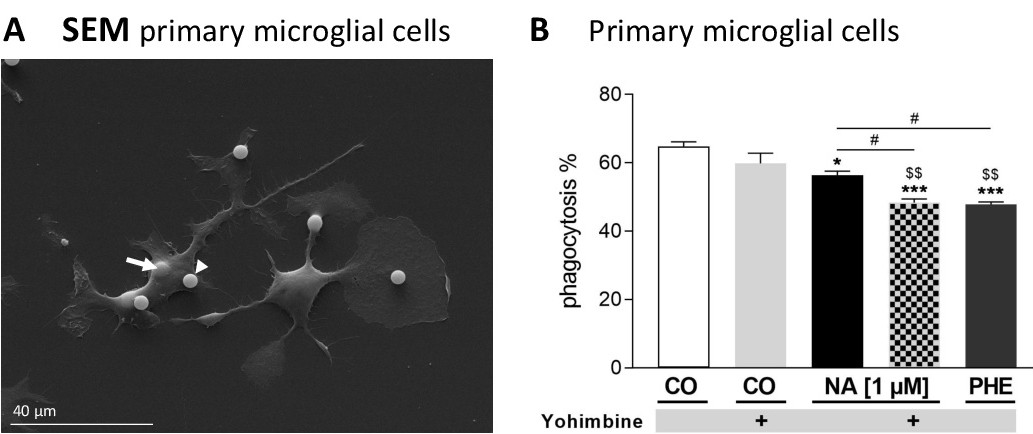
Fig. 8. Noradrenergic suppression of IgG-coated microspheres uptake in primary microglial cells. (A) Representative image of primary microglial cells showing attached (one example is shown with an arrow) as well as engulfed (one example is shown with an arrowhead) microspheres. (B) Average effect on microsphere uptake in the absence (CO) [white bar] and presence of (1) the α- and β-adrenergic agonist noradrenaline (NA 1µM) [black bar], (2) the α2-adrenergic antagonist, yohimbine (10 µM) [grey bar], (3) NA (1 µM) in addition yohimbine (10 µM) [hatched bar] and (4) the α1-adrenergic agonist, phenylephrine (PHE 10 µM) [dark grey bar]. Primary microglial cells were exposed to IgG-coated microspheres for 15 min (n=3). Asterisks denote significant differences when compared to control [white bar] and dollar signs $ denote denote significant differences when compared to CO + yohimbine [grey bar]. Hashes indicate significant differences as indicated. Mean±SEM; * p<0.05, ** p<0.01, *** p<0.001; $$ p<0.01; # p<0.05.